Last updated: August 10, 2026
A $449.7 billion bill says a lot. In 2023, U.S. prescription drug spending reached that level — and the path there was messy, not smooth. Some years jumped hard. Others barely moved. The real question for people paying for medicine is not just “Did prices go up?” but “What changed my bill, and why?”
Quick Answer
Prescription cost trends over the years in the U.S. have generally climbed over the past two decades. National spending rose as drug prices, use of medicines, and insurance design all changed. To compare older costs with current ones, you need to adjust for inflation and look at out-of-pocket costs separately from total spending. KFF notes that retail prescription spending is not the same as what patients pay at the counter.
Key Takeaways

- Total prescription spending has trended upward over time, but the pace has varied by year.
- Inflation matters. A price from years ago does not mean the same thing today.
- Brand-name drugs, specialty drugs, and fewer low-cost options can push costs up.
- Insurance changes can lower or raise what patients pay at the pharmacy.
- Generic drugs often slow spending growth and give people a cheaper option.
- The main limitation: national trends can hide what one person pays for one drug.
Why Prescription Costs Change
Several forces shape prescription cost trends over the years:
- Drug mix: More use of expensive specialty drugs can raise overall spending.
- Patent protection: When a brand drug has no generic version, prices often stay higher.
- Insurance design: Copays, deductibles, and tiered formularies affect what patients pay.
- Policy changes: Coverage rules and rebate practices can change the final cost.
- Demand: More people using medicine for long-term conditions can increase total spending.
These drivers do not move in the same direction every year, which is why prescription costs can rise even when some individual drugs get cheaper. And sometimes the numbers look like they’re arguing with each other. According to CMS, U.S. prescription drug spending reached $449.7 billion in 2023.
How to Read the Trend the Right Way
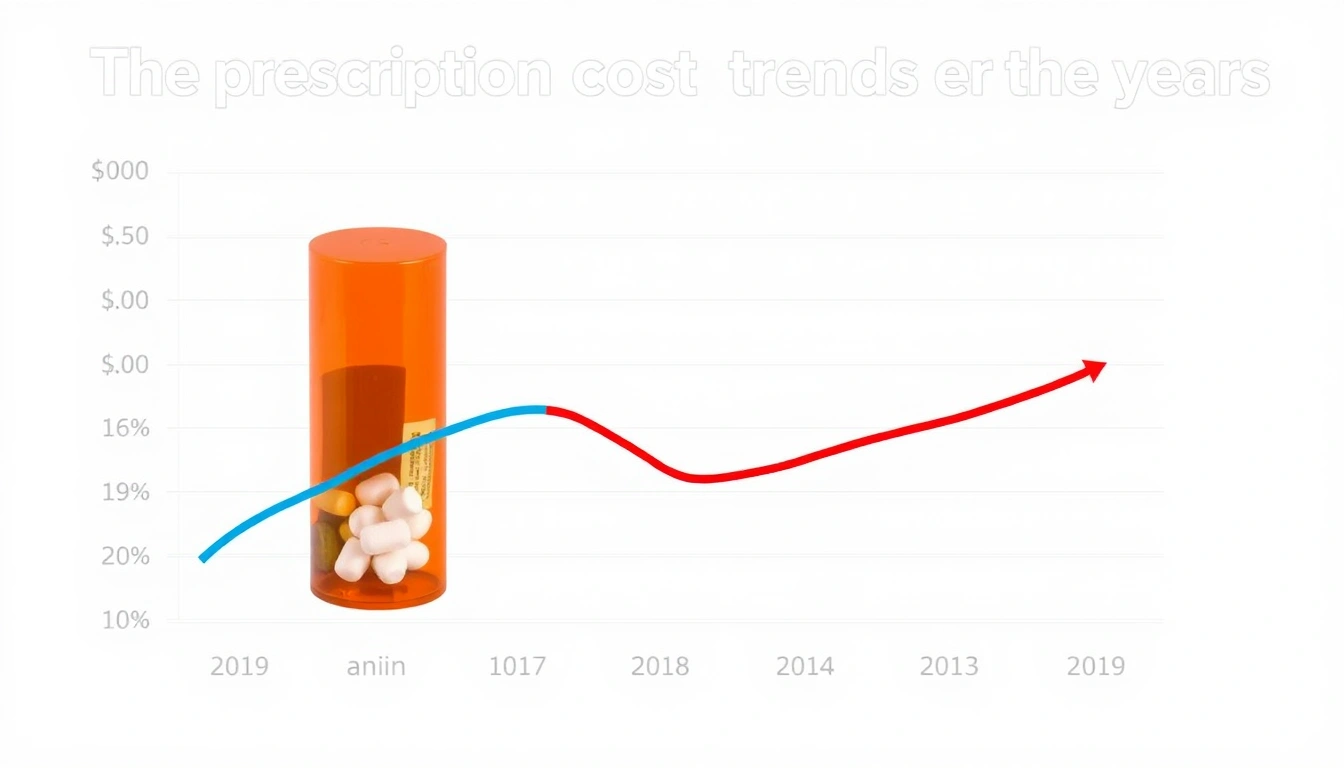
Want a fair read on prescription cost trends over the years? Start by comparing like with like:
- Separate list price from out-of-pocket cost. The sticker price is not always the amount a patient pays.
- Adjust for inflation. A drug that cost less years ago may not be cheaper in real terms.
- Compare the same type of medicine. Brand and generic drugs follow different paths.
- Look at per person and total spending. A bigger population or more use can lift total costs even if some prices hold steady.
- Watch policy changes. A new plan design can change patient bills without changing the drug itself.
Short version: context matters. Without it, the comparison gets slippery fast.
Benefits: Why This Trend Matters
Tracking prescription cost trends over the years helps people make better decisions.
- For patients: It can explain why a refill costs more this year than last year.
- For families: It helps with budgeting for long-term medicine use.
- For employers and insurers: It shows where spending pressure is building.
- For policymakers: It points to areas where lower-cost choices could help.
Knowing the trend also makes it easier to ask useful questions at the pharmacy or during a plan review. For example, CDC’s National Health Interview Survey shows that 6.1% of U.S. adults did not take medicine as prescribed because of cost in 2023.
Alternatives and Comparisons
Prescription drugs are not the only way to manage a health problem, but options depend on the condition and the plan. In some cases, the lower-cost option may be:
- a generic version instead of a brand-name drug
- a different drug in the same class
- a treatment plan that relies more on lifestyle changes
- a mail-order or preferred pharmacy option, if the plan allows it
The best choice depends on the condition, the drug, and the insurance plan. A cheaper option is not always the right option, especially if it works less well or causes more side effects. Sometimes the bargain is a mirage. A clinician or pharmacist can help compare options safely. For details on coverage and drug tiers, see the plan formulary and generic drugs.
Common Mistakes
A few errors can make prescription cost trends over the years look worse or better than they really are:
- Using unadjusted prices can make older costs seem smaller than they were.
- Mixing up total spending and patient cost can lead to the wrong conclusion.
- Ignoring generics can hide a major reason costs slowed in some periods.
- Treating one drug as the whole market can distort the bigger picture, so patients should review a pharmacist or clinician’s advice and use a source such as KFF or CMS before drawing conclusions.
The Main Drawback
Trend data is useful, but it has a limit: it can describe the market without showing what one person actually pays. Two people can fill the same prescription and see very different bills because of insurance, pharmacy choice, coupons, or deductibles. For personal decisions about medicine costs, a pharmacist, clinician, or financial counselor can help. If you need to compare prices, check a drug coverage guide, or ask your plan about copays and deductibles.
Bottom Line
Prescription costs over the years have mostly moved upward, but the reasons are mixed. Drug type, insurance design, policy shifts, and inflation all matter. The clearest view comes from comparing similar medicines, adjusting for inflation, and separating total spending from the amount paid at the counter.