Last updated: August 10, 2026
Prescription drug prices have climbed over time. Some years, the jump is obvious; other times, it hides in the fine print of insurance or inflation. This overview of prescription cost trends over the years depends on whether you look at sticker price, inflation-adjusted cost, or what people actually pay after insurance. For anyone trying to budget for medicine or compare old prices with new ones, that difference matters, and the CDC and CMS both note that price measures can vary by source and method.
Quick Answer
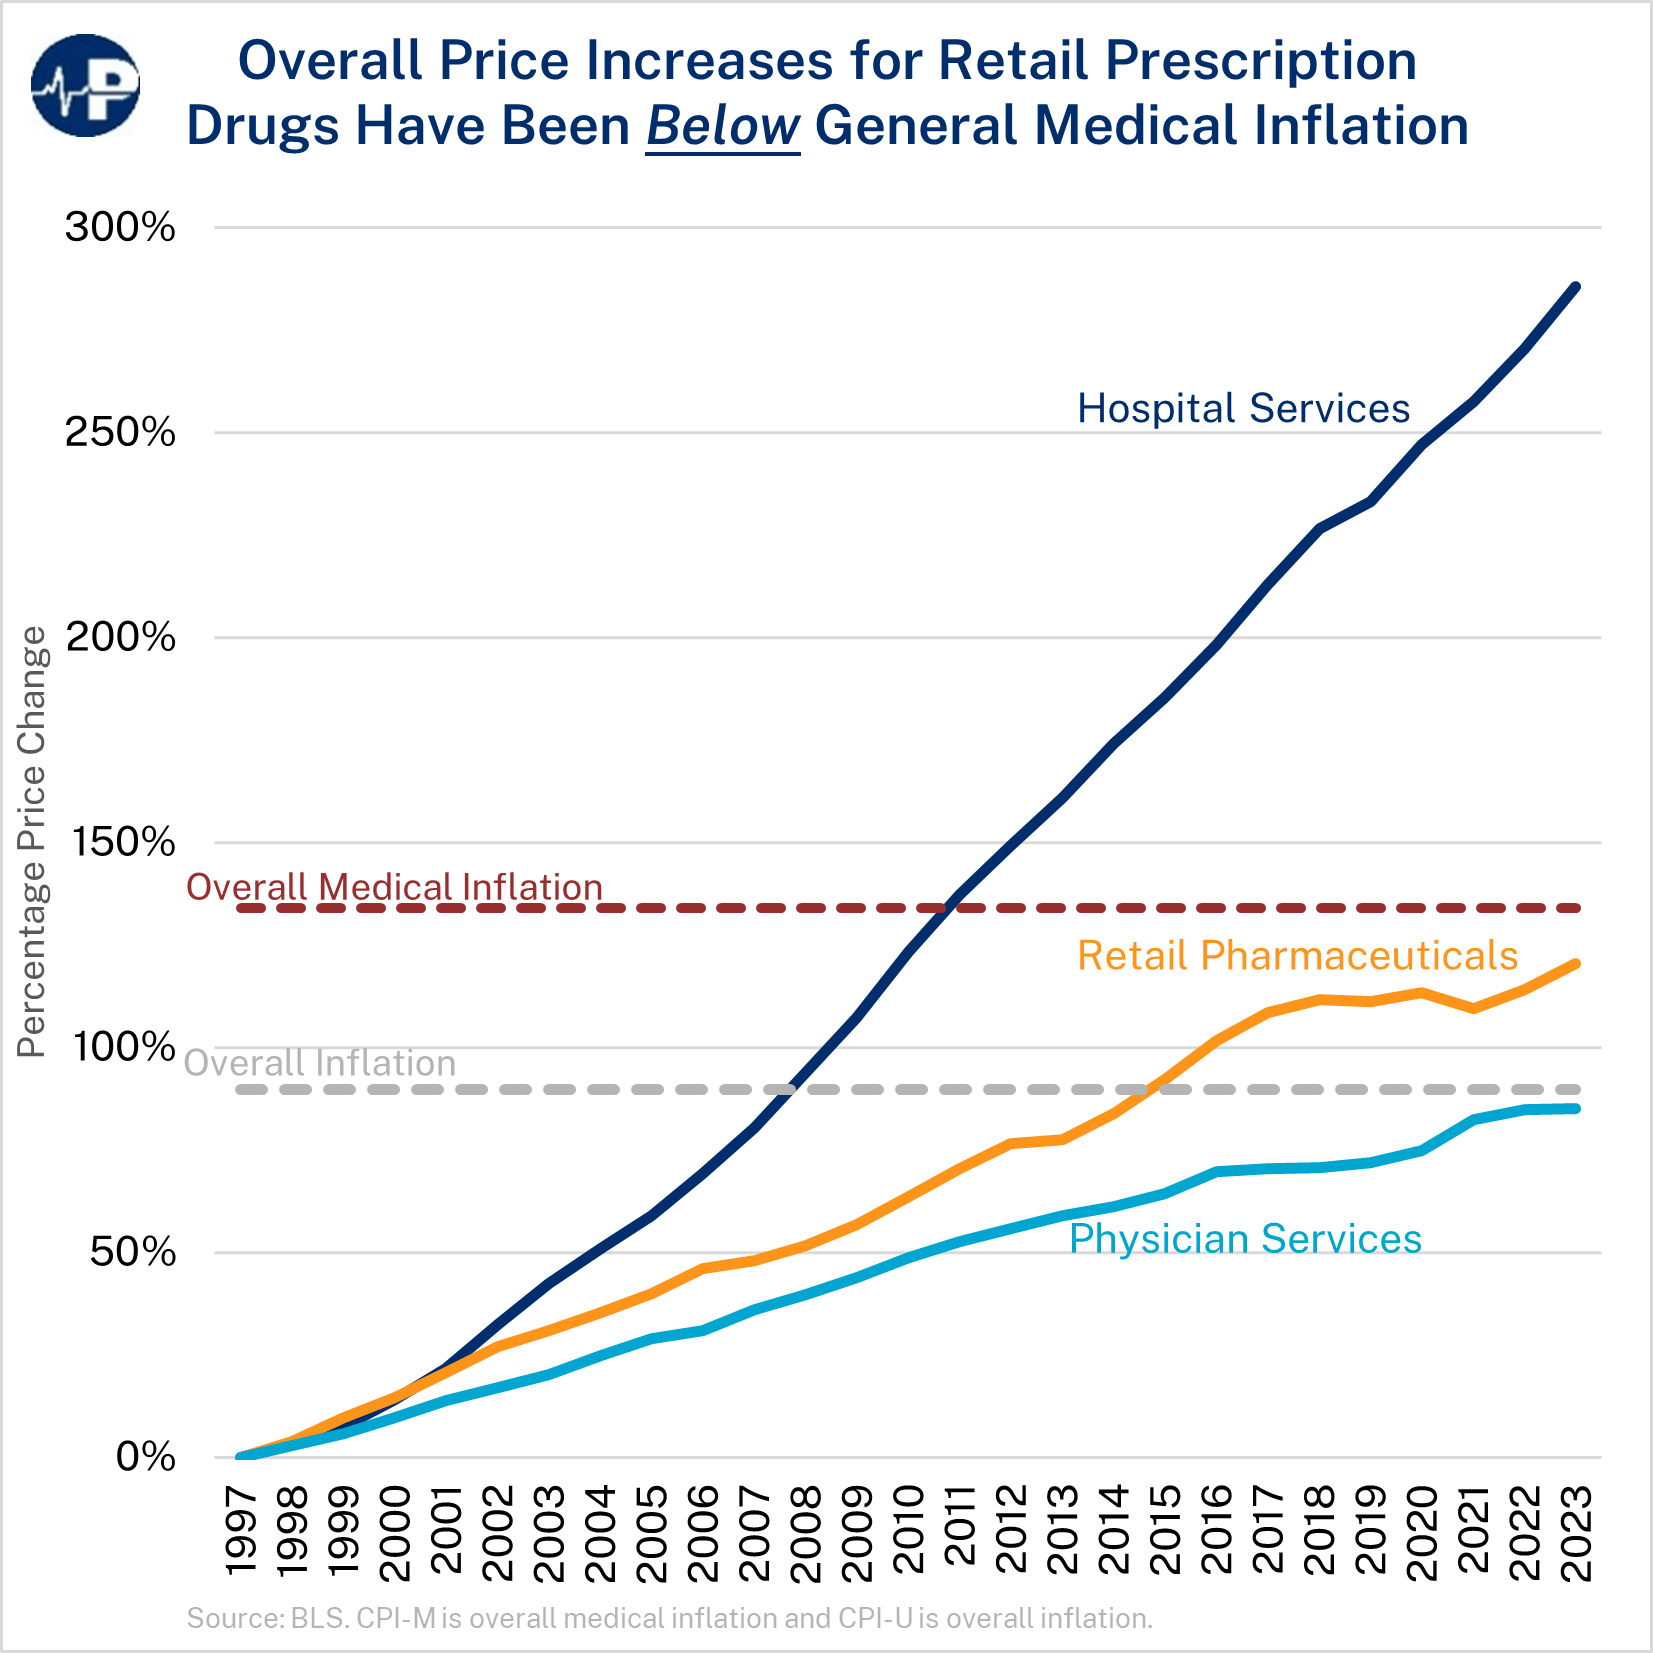
U.S. prescription spending has gone up over the years, but not in a neat straight line. For example, U.S. prescription drug spending reached about $405 billion in 2022, according to the Kaiser Family Foundation. Some medicines got much more expensive, while others became cheaper after generics entered the market. To judge the trend fairly, compare prices after adjusting for inflation and separate total drug spending from out-of-pocket costs.
Key Takeaways

- Prescription costs have been shaped by drug launches, patent rules, insurance design, and the spread of generic drugs.
- Inflation matters: a price from 10 or 20 years ago can look smaller than it really was if you do not adjust it.
- A single national trend can hide big differences between brand-name drugs, generics, and specialty medicines.
- What patients pay at the pharmacy can move differently from what insurers or the health care system pay overall.
- If you are making a budgeting or treatment decision, a doctor, pharmacist, or insurance expert can help you check the real cost; for drug price context, see the CMS drug spending data and FDA generic drug information.
What Has Changed Over Time
Older prescription drugs often became less expensive once generics entered the market. Plainly put, that reset a lot of price tags.
At the same time, newer drugs often launch at higher prices than older treatments, although the exact pattern varies by drug and market. Specialty medicines are a big part of that story; they may treat complex or rare conditions and can require more research, smaller patient groups, or special handling. If you are comparing treatment options, it is wise to consult a clinician or pharmacist and review source data from the FDA or KFF.
Insurance also changed the picture. Higher deductibles, tiered formularies, and copay rules can shift more cost to the patient even when a drug’s list price does not change much. So the amount on the receipt may rise even if the underlying drug price grows more slowly. That gap can sting.
Why Prescription Costs Rose

Several forces have pushed costs up over the years, though the size of each effect can differ by drug and plan:
- New drug development: New treatments can cost more than older ones, especially when they offer a new way to treat a disease.
- Patent protection: While a drug is protected, competitors usually cannot sell a generic version.
- Insurance design: Copays, deductibles, and formulary tiers can change what patients feel at the counter.
- Specialty drugs: These often target hard-to-treat conditions and tend to have higher prices; for a treatment decision, consult a professional and check the Medicare drug coverage rules.
- Use of more medicine: As people live longer and more chronic conditions are treated with medication, total spending can rise; for individual care, a doctor or pharmacist can help confirm what applies.
And the mix matters. A brand-new therapy with patent protection can climb fast, while an older pill may sit there almost unchanged until a generic arrives. That math stops working fast once the market shifts.
Benefits of Tracking the Trend
Watching prescription cost trends helps people make better choices. A patient may see that one medicine is rising fast and ask about a lower-cost alternative. A family may compare a brand-name drug with a generic and save money. Employers and policy makers can also use the trend to spot where spending is most likely to grow.
This kind of review is useful because it separates two questions that are often mixed together: “What does the drug cost?” and “What will I pay for it?” Clear answer. Different numbers.
Alternatives and Comparisons
If you are trying to manage costs, compare these options:
- Generic vs. brand-name: Generics usually cost less and work the same for many common medicines, though not every drug has a generic option.
- Prescription vs. over-the-counter: Some conditions can be treated with nonprescription medicine, which may cost less.
- One drug vs. another in the same class: Different medicines can treat the same problem at very different prices.
- Mail-order vs. local pharmacy: In some cases, one channel may be cheaper, but it depends on insurance and the drug itself.
The cheapest label is not always the best fit. To be fair, the right choice is the one that matches the condition, the insurance plan, and the patient’s budget.
How to Read the Trend Without Getting Misled
A clean analysis should do a few things:
- Compare prices across the same type of drug.
- Adjust older prices for inflation.
- Separate total spending from out-of-pocket cost.
- Note when a drug lost patent protection.
- Check whether the price change came from the drug itself or from insurance rules.
Leave those pieces out, and the picture can tilt badly in either direction. So consult a pharmacist, clinician, or insurer when you are using the numbers to make a decision.
Honest Limitation
One drawback of this kind of overview is that prescription cost data can be hard to compare across years. List prices, negotiated prices, and patient payments are not the same thing. That means a simple chart can hide the real burden on families. For personal medication decisions, it is wise to confirm the current price with a pharmacist or clinician.
What to Expect
A basic review of prescription cost trends over the years can be done quickly, but a careful one takes more time because the data is split across drug types, payers, and years. The main benefit is clarity: once you sort out inflation, insurance, and drug type, the pattern is easier to read. Still, no single summary tells the whole story, so use it as a guide rather than a final answer.